

HIGHLIGHTS
- S&P 500 Index Valuation Concerns
- The FED’s Inflation and Employment Dilemma
- Chart of the Quarter: High Yield Bond Market Inflection Point
- Quarterly Outlook
S&P 500 INDEX COMMENTARY
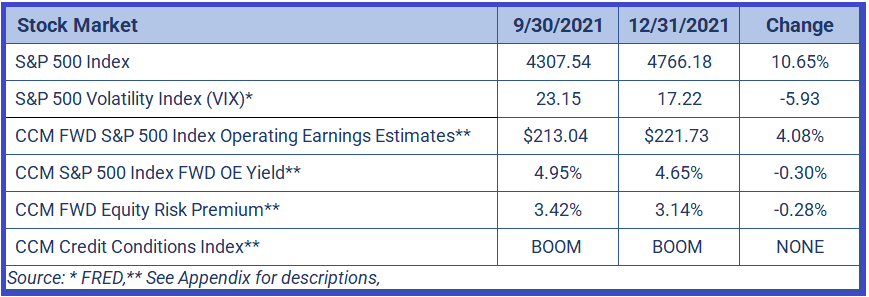
After being relatively flat last quarter, the S&P 500 Index rallied over 10% during the fourth quarter as market fears subsided almost immediately as Q3 closed. The stock market booked most of its gains by mid-November, then volatility hit at the end of November with the announcement of the spread of Omicron, a variant of the COVID virus. The VIX Index reached into the high volatility area by hitting 31 on December 1st as these fears played out in the options market. The rest of December was volatile as the market shrugged off this new COVID variant, perceived to be less severe than earlier variants. Inflation was also a concern for most investors looking into 2022 as supply chain issues and low unemployment levels could mean that inflation will continue if the Fed is still accommodative in 2022. Even given three to four expected rate increases next year, the Fed is still far from an average neutral rate of 2% and even farther from actual monetary tightening to combat these inflationary pressures. Is this time different due to the pandemic? Maybe, but if the Fed is wrong, they risk runaway inflation.
Index Earnings
Revisions to the one year forward operating earnings estimates slowed but still increased for the quarter. 2022 IBES estimates for the S&P 500 Index operating earnings on December 31st estimate for 2022 was $223.04, up from $219.84 on September 30th. (Up 1.45% for the quarter) The previous quarter saw an increase of 2.85% for 2022 operating earnings estimates. The 2021 market was fueled by upward earnings revisions for 2022. Revisions may be slowing due to potential margin squeeze on rising inflation as cost of almost everything increased during the quarter. With the Federal Reserve set to hike interest rates modestly this year, long term financing rates could rise with the Ten-Year Treasury Note yield above 2.0% sometime in 2022. A slowing, or even declining, EPS growth due to inflation concerns, could be a challenge for the S&P 500 Index continued price appreciation, especially at the same pace prices appreciated since the bottom of the virus crash in 2020.
Index Valuation
Current valuations, as measured by the S&P 500 Forward P/E Ratio, are at levels not seen in over two decades. The primary driver behind these levels, which has been accommodative monetary policy by the Fed, is about to end in 2022 as they begin to hike rates and curtail purchases of Treasury Notes for their balance sheet. This leaves major US equity indexes in a vulnerable position as current valuations leave little room for error in terms of meeting earnings expectations. This is further exacerbated by uncertainties around cost pressures, supply issues, policy uncertainty and tax changes. As rates rise, longer duration (typically higher growth) companies suffer the largest pull back in prices and valuations. The S&P 500 Index, which is capitalization weighted, is composed of the largest US high growth companies and as a result is more susceptible to rising rates.
COMMODITIES, INTEREST RATES AND CREDIT MARKETS
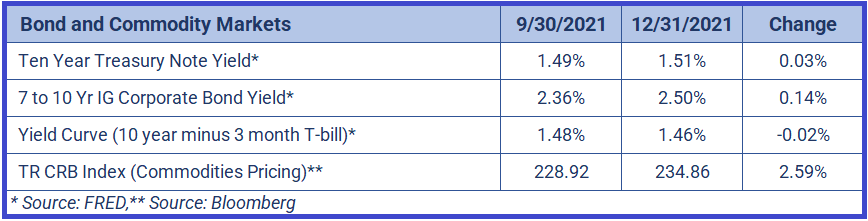
Short and long rates were relatively unchanged for the quarter even as inflation was well above the Fed’s target of around 2.0%. The Fed has removed the word ‘transitory’ inflation from its language, but CCM is in the small number of investors that believe that the Fed should be at 2% currently and raising rates from there. Inflation has been running at elevated levels due to supply chain issues but also low labor participation rates even as the unemployment rate for December 2021 was at 3.9%. Every time is different, but the real question is: Why is the Fed still at accommodative levels when inflation is running hot, and unemployment is well below 5% (typically full employment)? Even if 4% is the new 5%, it’s still below what most consider full employment levels. This leaves a huge potential for wage inflation to continue as the Fed’s current policy could be perceived as lagging.
Looking at the Taylor Rule, which is a fixed rule policy that uses a combination of inflation and unemployment to forecast fed interest rate targets, it’s at levels that look like the rule is broken. As seen in the Bloomberg chart, the Taylor Rule Estimate is calling for 9% short term rates. While this is likely not going to be the Fed’s policy target, this model only shows how much the Fed is behind the tightening schedule. This time is different, right? What about low labor participation? What about the wave of employees exiting the workforce or retiring? If it’s not different this time, however, then the Fed is taking a huge inflation risk by keeping rates at crisis levels. If inflation persists, the Fed will have to go faster and bigger with their tightening schedule, which could cause a shock in risk markets like the S&P 500 Index.
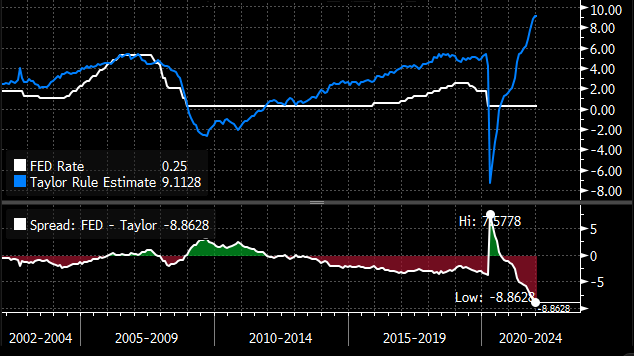
CHART OF THE QUARTER: HIGH YIELD BOND MARKET INFLECTION POINT
High yield bonds have done well since the virus crash in March 2020 as yields and bond spreads have come down significantly off the highs. Yield hungry investors have pushed these bond prices to 20-year extremes effectively pushing high yield bond valuations in the same area as stocks: Expensive.
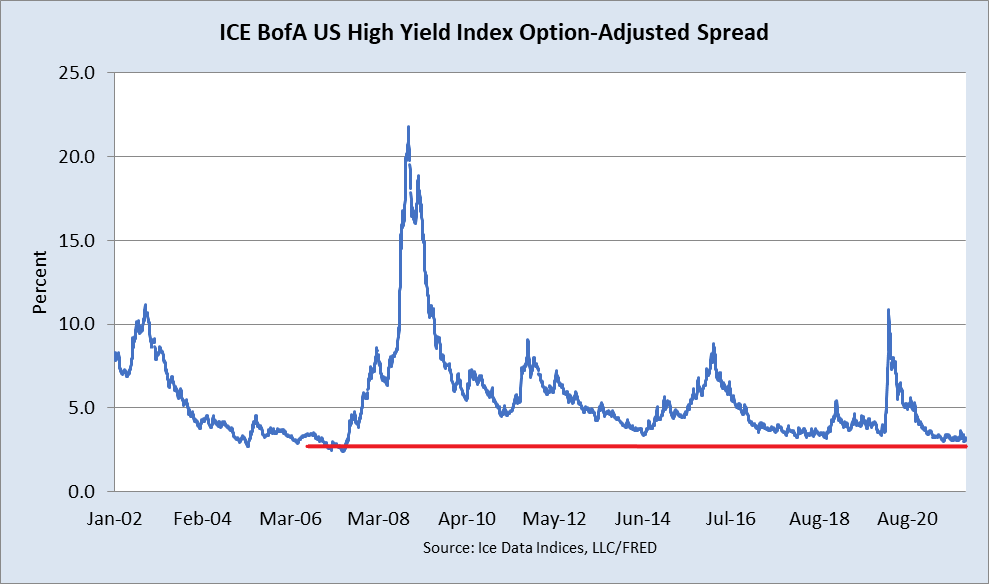
High yield bond spreads (additional yield above a comparable risk-free interest rate) sunk to levels not seen since 2007. Investors have hurried into this market seeking yield while throwing any caution out the door. Just like most parts of the bond market, high yield investors are putting a large premium on a relatively risky asset class. Most parts of the bond market are overvalued by all metrics, but high yield is especially important to watch since any credit problems will start to rise in this market initially, eventually finding a way into the equity markets. For the most part, spread widening is one of the first signals to take ‘risk off’.
The current market may be different though since not only spreads are at lows, but yields are at 20-year lows. With yields this low any credit deterioration in the high yield credit market, in combination with rising U.S. Treasury rate curve, could cause a very convex downside depreciation in price in both high yield bonds and potentially stocks. A high yield price correction could be worse than the price depreciation during the 2008 financial crisis since prices are extremely high, meaning downside price convexity is at its 20-year extreme.
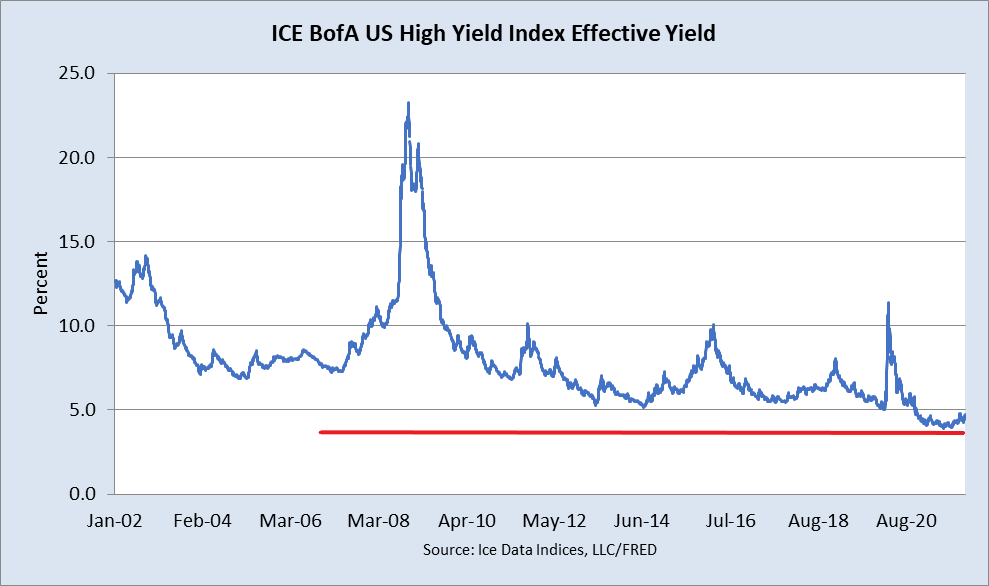
The good news is that the S&P 500 Index typically does well when high yield spreads are at lows. Usually when the index is in the bottom 20% of its 3-year range, the stock market tends to appreciate as bond investors are comfortable with risk even as they are likely not getting paid for the heightened risks of the high yield bond market. This also typically means companies are getting cheap financing to lever their operations at historic low yields. Good for issuers of debt (stocks), bad for buyers of debt (bonds). Equities are the best option at these levels, but any spread widening in the high yield market should send a message to stocks that credit is tightening with a potential recession coming if the deterioration continues.
QUARTERLY OUTLOOK
Inflation and U.S. employment will continue to be watched very closely as the Fed may alter their plans if the situation gets out of control. Although it’ll probably take until the end of the summer for the Fed to really make a real judgment on inflation and employment situation. Interest rates will be affected one way or another as Treasury yields are still pricing this inflation as ‘transitory’ (short term). The new COVID variant, Omicron, seems to be mild compared to others and with any positive news associated with getting consumers back to gathering and traveling again will be a positive for stocks, but at these valuation levels, it may be more of a ‘buy the rumor, sell the fact’ kind of trade. (neutral)
The S&P 500 Index seems to be sitting on a thin glass shelf supported by low interest rates with most of the important valuation and growth metrics in overvalued territory. This glass shelf could break as rates rise due to inflation expectations and put pressure on risk assets. Stock markets usually take a while for valuation to catch up but rising rates and/or rising credit risk could send the S&P 500 Index downward. Couple that with an external shock risk and you have all the signs that hedging may be the best thing to do after stocks have risen exponentially since the bottom of the virus crash in 2020.
Rick Coryell, CFA
Chief Investment Officer
Michael Treidl, CFA
Director
Coryell Capital Management, LLC
Research Papers and Commentary Disclosures
This commentary is presented for information purposes only. It is intended for your personal, non-commercial use. No information or opinions contained in this commentary constitute a solicitation or offer by Coryell Capital Management to buy or sell any securities or commodity interests, or to furnish any investment advice or service. This commentary is intended as a general introduction to Coryell Capital Management and its products. It does not provide specific investment advice, nor does it represent that the services described are suitable for any specific investor. Moreover, the information contained in this commentary does not provide a basis for making a fully informed investment decision. Those considering an investment in a Coryell Capital Management sponsored product should request a copy of the applicable Disclosure Document which contain important legal disclosures and risk factors. Also, please note that investments in markets traded by Coryell Capital Management involve significant risk. The risk of loss in trading commodity interests can be substantial. Therefore, you should consider carefully whether such trading is suitable for you. Trading in commodity interests often involves the use of leverage which can amplify both gains and losses. All investments in commodity interests should be made with risk capital only as investors could lose all or substantially all their investment. Past performance is not indicative of future results. Information contained on this commentary, including pricing, valuation, and commentary on any markets traded by Coryell Capital Management, reflects Coryell Capital Management’s internal analysis and other information available at either the time such information was posted on the commentary or as otherwise at the date indicated. While any opinions, commentaries, data, pricing, and all other information contained on this commentary are believed to be reliable, Coryell Capital Management cannot and does not guarantee its accuracy, timeliness or completeness, nor is Coryell Capital Management under any obligation to update such information.
Appendix
CCM uses a several sources for the S&P 500 Index operating earnings. CCM uses a blended estimate and other factors to forecast 1 year forward operating EPS. This can affect other CCM calculations: CCM FWD S&P 500 Index Operating Earnings Estimates, CCM S&P 500 Index FWD OE Yield, CCM FWD Equity Risk Premium.
Credit Conditions Index: CCM uses a multifactor model consisting of various bond market statistics and intra and inter credit market spreads to determine the underlying U.S. credit environment. The model output is then put into categories BOOM, Normal, and CRISIS modes. CCM uses the credit model to incorporate credit risk environment into its proprietary S&P 500 Index Factor Model.
