

HIGHLIGHTS
- S&P 500 Earnings Revisions Pointing Flat to Down
- Inflation Concerns Shocks the Consumer (Bond Market Thinks this Time is “Transitory”)
- CHART OF THE QAURTER: VIX INDEX REGIMES
S&P 500 INDEX COMMENTARY
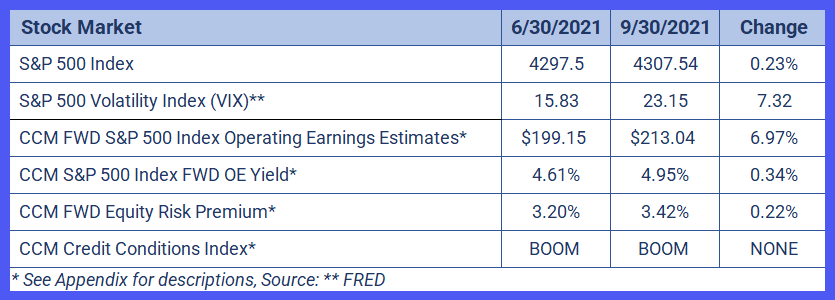
After a substantial rally in Q2, The S&P 500 Index was flat for the quarter. Initially the index hit a new high above the 4500 level before retreating in September. The market has been challenged due to supply chain constraints and higher inflation worries. Energy markets, especially crude oil and natural gas, also hit new highs exaggerating inflation worries. Although with the energy sector now sitting at only 2.7% of the S&P 500 Index, it does not have the influence to move the index like it once did.
Index Earnings
One year forward operating earning’s estimates were up around 7% for the quarter as the global economy starts to get back to somewhat normal. Current earnings have been helped by the Federal Reserve’s easy interest rate policy, but forward earnings looks like they are at an inflection point. At the end of the quarter, S&P 500 Index earnings revisions[1] were flat to down for the first time since last year. The inflection point represents the fact that a lot of the earnings have been manufactured with lower interest rates, shifting of consumer preferences and accommodative fiscal policy. The inflection point could be the fact that forward earnings could be impacted by higher interest rates and higher supply chain costs. Two items that are going to continue to be concerning in the next quarter for most companies.
Index Earnings Growth
Earnings growth may be challenged due to higher inflation, supply chain issues and potential higher Interest rates. This means that costs could run higher than any potential revenue growth.
With earnings being propped up with easy monetary that may be ending soon and limited fiscal policies due to debt ceiling constraints, growth of earnings may be challenged in the next few years. Some of these concerns are already baked into the recent revisions by analysts citing these issues in their forecasts. If inflation is not “transitory”, like the Federal Reserve keeps telling us, this could have an effect on long term interest rates rising. This could damper any potential future earnings growth in the next few quarters and put a cap on long term assets like stocks and real estate.
INTEREST RATES AND CREDIT MARKETS
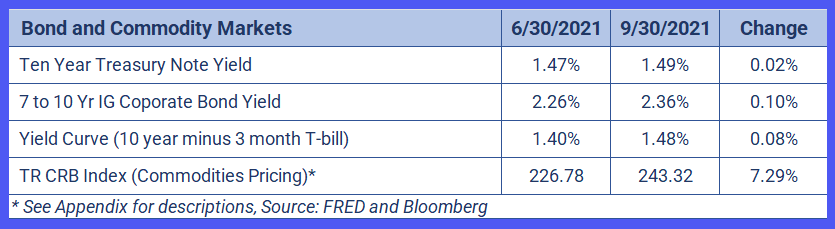
The Ten-Year Treasury Note was essentially unchanged, rising only 2 basis points to 1.49% during the third quarter. Investment grade bond yields increased as the BAML 7 to 10-Year IG index yield rose 10 basis points to 2.36%. We are in a low credit spread environment which is considered a growth catalyst for equity markets, as cheap borrowing leads to lower interest costs, more leverage, and larger earnings. As market pundits continue to debate whether inflation is “transitory” as the Fed insists it is, we look to the bond market for perspective. The 10-Year Breakeven Inflation Rate, which is the bond market’s forecast for inflation over the next 10 years, fluctuated between 2.2% and 2.4% during the third quarter with a breakout toward 2.5% days after the third quarter ended. Further evidence of an upward inflation trend can be seen in the Commodity Research Bureau (CRB) Index, which increased 7.29% in the third quarter. Energy prices, which make up 39% of the index, have contributed to the overall rise in commodity prices and inflation for U.S. consumers. This recent upward trend warrants caution, as an increase in expected inflation will move forward the rising of rates by the Fed and in turn limit earnings growth for companies in the S&P 500 Index.
CHART OF THE QUARTER: VIX INDEX REGIMES
The VIX Index is a measure of market volatility, but it also is a measure of relative certainty about the stock market, specifically the range of S&P 500 Index forward earnings and the certainty of future earnings growth. This fear/greed index is useful in several ways, but historically the index could be divided in regimes with stock market investors having different market allocations and hedging strategies for each regime.
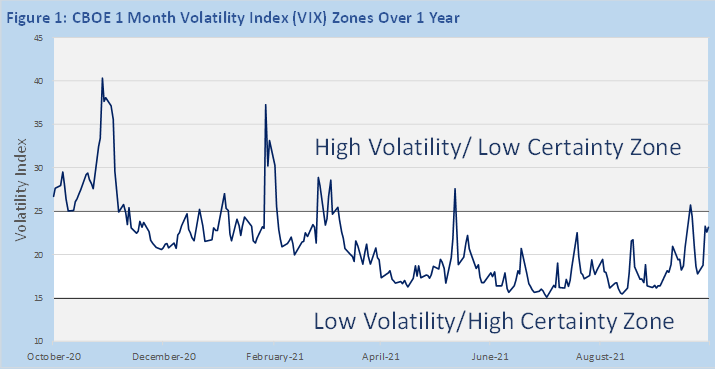
Tracking earnings and earnings growth of the S&P 500 Index is essential for any market-based valuation model. In low-to-average VIX regimes, the range of forward EPS for the index is tight due to the relative certainty about EPS forecasts. Risks are perceived by the market as low with the stock market typically trending upward on certainty about EPS growth. While the market is within these regimes, a solid fundamental model will do well to predict the market within a tight range of possibilities.
When the market experiences high volatility due to uncertain events and heightened risks, earnings and earnings growth predictions are thrown out the window. Investors are wise not to adhere to fundamental models or are forced to expand the range of possibilities to a point that the model doesn’t provide a reliable forecast during high volatility. Analysts will downgrade earnings forecast but even these experts are staring into a very uncertain future. Investors are forced to either ‘sell everything’ in a panic or look to other variables to decide when relative certainly will return to the market. This is the riskiest regime, but there are several factors that do well in high volatility regimes that can replace a fundamentally based stock market forecast.
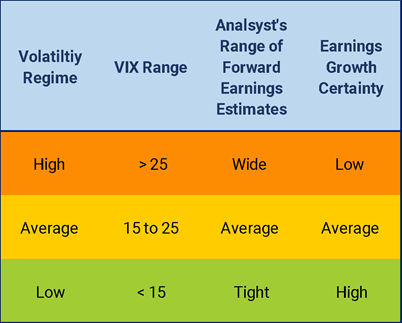
During the quarter, the VIX experienced some heightened volatility, but only spent one day above 25, September 20 at 25.71. Earnings estimates have topped and there are worries about inflation and supply chain constraints that could affect future earnings growth, but earnings forecasts are more certain than they were last year. While still at the high end of the average range, investors are still relatively more certain about today’s environment, but a VIX breakout above 25 should warrant hedges if investors are using fundamentally based valuation models to allocate to the stock market.
Rick Coryell, CFA
Chief Investment Officer
Michael Treidl, CFA
Director
Coryell Capital Management
Research Papers and Commentary Disclosures
This commentary is presented for information purposes only. It is intended for your personal, non-commercial use. No information or opinions contained in this commentary constitute a solicitation or offer by Coryell Capital Management to buy or sell any securities or commodity interests, or to furnish any investment advice or service. This commentary is intended as a general introduction to Coryell Capital Management and its products. It does not provide specific investment advice, nor does it represent that the services described are suitable for any specific investor. Moreover, the information contained in this commentary does not provide a basis for making a fully informed investment decision. Those considering an investment in a Coryell Capital Management sponsored product should request a copy of the applicable Disclosure Document which contain important legal disclosures and risk factors. Also, please note that investments in markets traded by Coryell Capital Management involve significant risk. The risk of loss in trading commodity interests can be substantial. Therefore, you should consider carefully whether such trading is suitable for you. Trading in commodity interests often involves the use of leverage which can amplify both gains and losses. All investments in commodity interests should be made with risk capital only as investors could lose all or substantially all their investment. Past performance is not indicative of future results. Information contained on this commentary, including pricing, valuation, and commentary on any markets traded by Coryell Capital Management, reflects Coryell Capital Management’s internal analysis and other information available at either the time such information was posted on the commentary or as otherwise at the date indicated. While any opinions, commentaries, data, pricing and all other information contained on this commentary are believed to be reliable, Coryell Capital Management cannot and does not guarantee its accuracy, timeliness or completeness, nor is Coryell Capital Management under any obligation to update such information.
Appendix
CCM uses a several sources for the S&P 500 Index operating earnings. CCM uses a blended estimate and other factors to forecast 1 year forward operating EPS. This can affect other CCM calculations: CCM FWD S&P 500 Index Operating Earnings Estimates, CCM S&P 500 Index FWD OE Yield, CCM FWD Equity Risk Premium.
Credit Conditions Index: CCM uses a multifactor model consisting of various bond market statistics and intra and inter credit market spreads to determine the underlying U.S. credit environment. The model output is then put into categories BOOM, Normal, and CRISIS modes. CCM uses the credit model to incorporate credit risk environment into its proprietary S&P 500 Index Factor Model.
[1] IBES Estimates
